In the ever-evolving landscape of data analysis, Julius AI emerges as a game-changer, providing an intuitive and powerful solution for interpreting, analyzing, and visualizing complex data. Let’s delve into the facets that make Julius AI a must-have tool for anyone seeking to supercharge their data analysis.

What is Julius AI
At its core, Julius AI is an intelligent data analyst tool designed to demystify the complexities of data analysis. What sets it apart is its ability to make data accessible and actionable, regardless of the user’s background in data science.
Special Features
1. Analysis
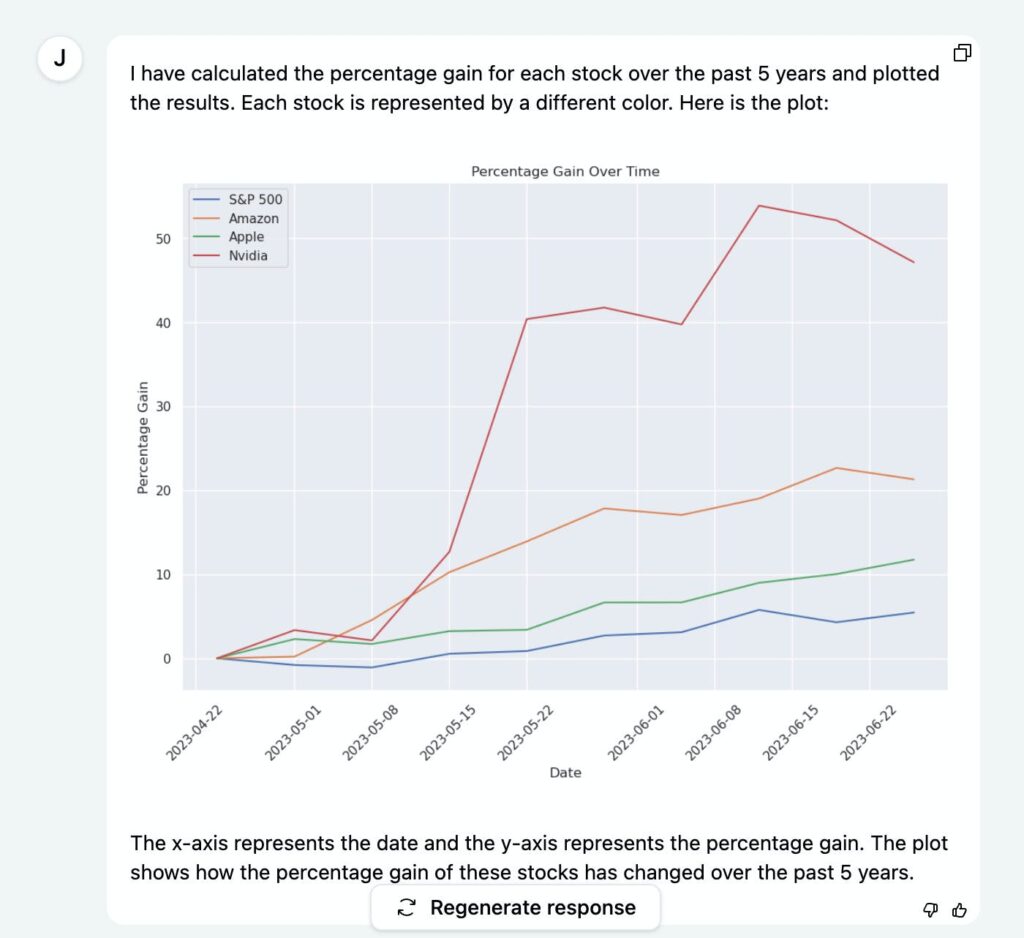
Julius AI can analyze any form of structured data. Simply ask questions, and let Julius perform the analysis for you.
2. Visualizations
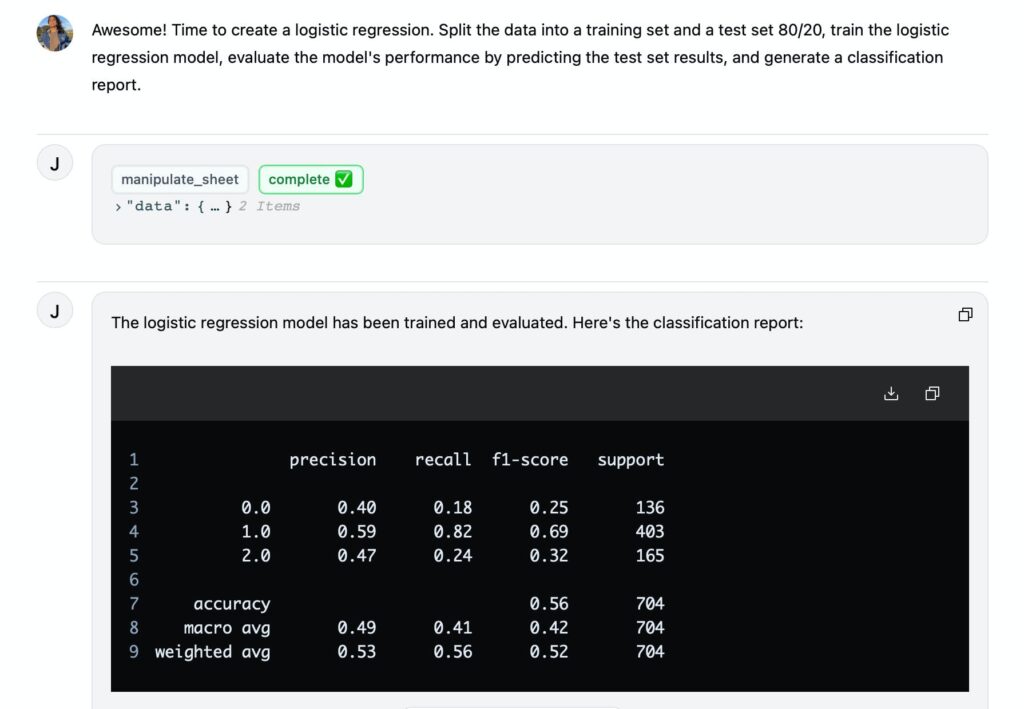
Generate sleek and informative data visualizations effortlessly, using straightforward instructions.
3. Advanced Features
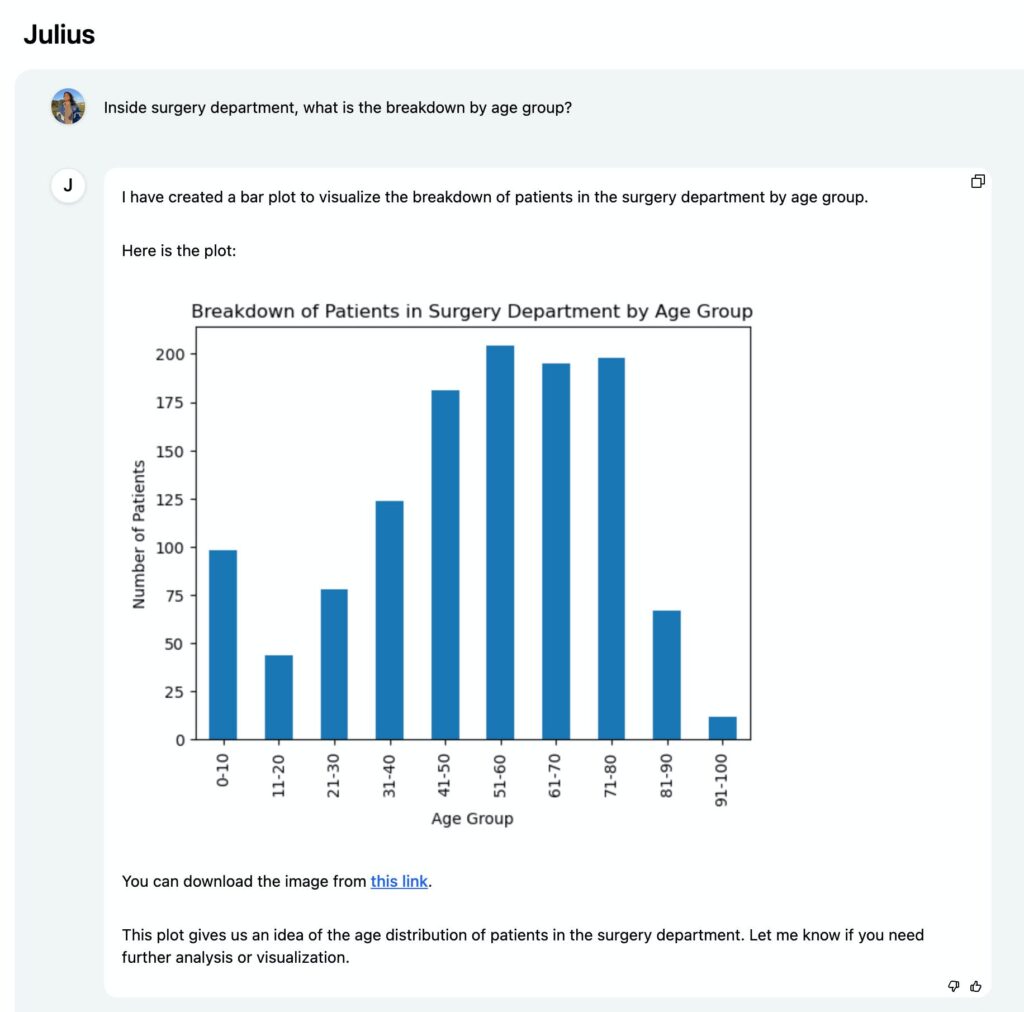
Take your analysis to the next level with advanced features like Linear Regression, Modeling, Projections, and even dynamic data animations.
4. Time-Saving
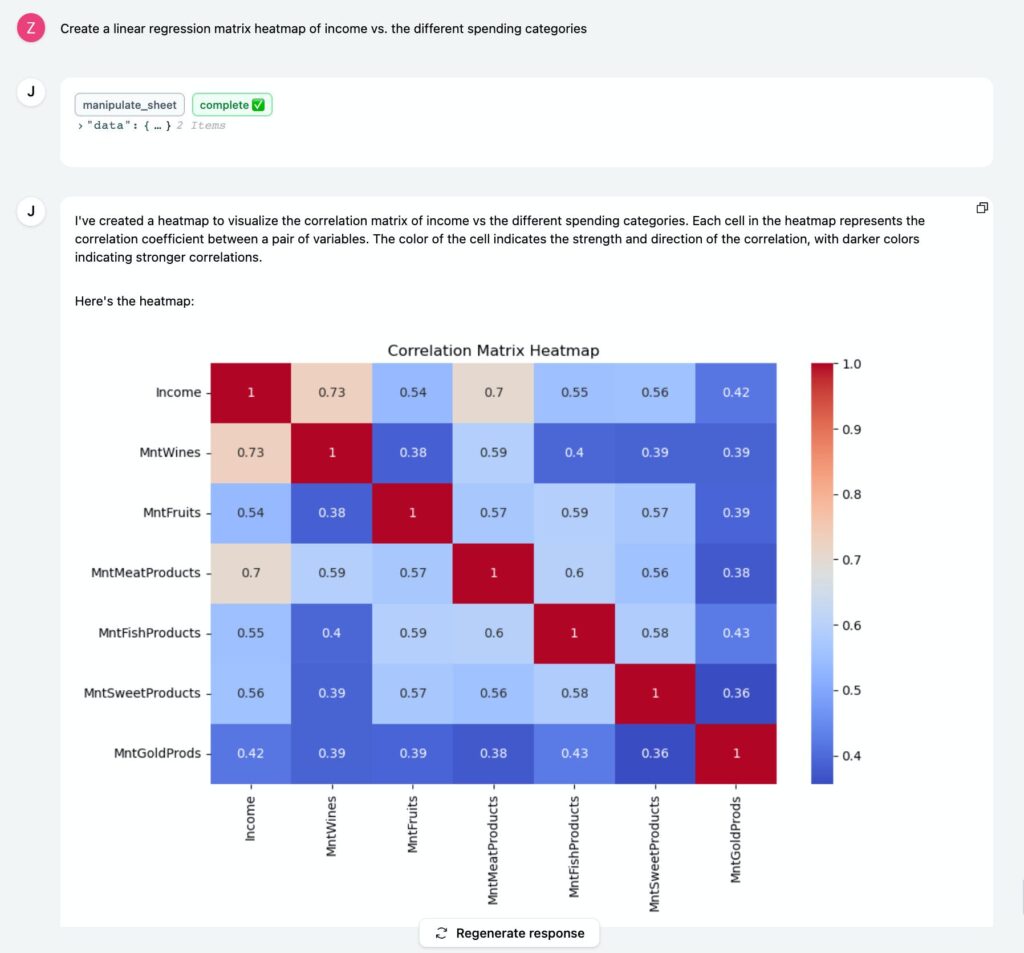
Bid farewell to hours spent on Excel. With Julius, transform lengthy tasks into quick, efficient processes.
5. Sleek Visualizations
Communicate your findings with confidence, thanks to Julius’ ability to generate visually appealing representations of your data.
6. Ask Data Questions
Pose queries, and Julius provides answers in seconds, eliminating the need for tedious manual data exploration.
7. Cleaning Made Effortless
Automate data preparation, allowing you to focus on the core insights without getting bogged down by data cleaning tasks.
8. Export Instantly
Download your analyzed data instantly in CSV or Excel formats, facilitating seamless sharing and collaboration.
9. Create Captivating Animations
Bring your data to life with dynamic GIFs, adding a layer of engagement to your presentations or reports.
10. Unlock Statistical Modeling
Access expert-level insights without grappling with the complexities, as Julius simplifies statistical modeling.
In essence, Julius AI empowers you to supercharge your data analysis, ensuring you extract the utmost value from your datasets.
Julius Start Guide
Step 1: Linking a Data Source
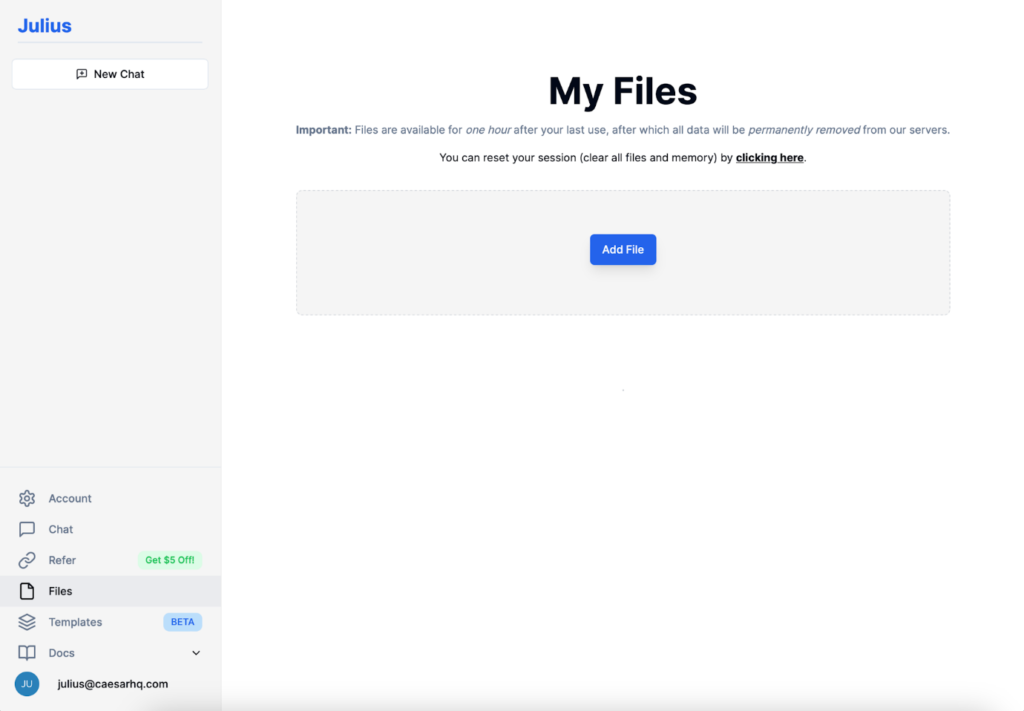
Navigate to the My Files tab, click “Add File,” and either upload your file or connect to a Google Sheet via Share from URL.
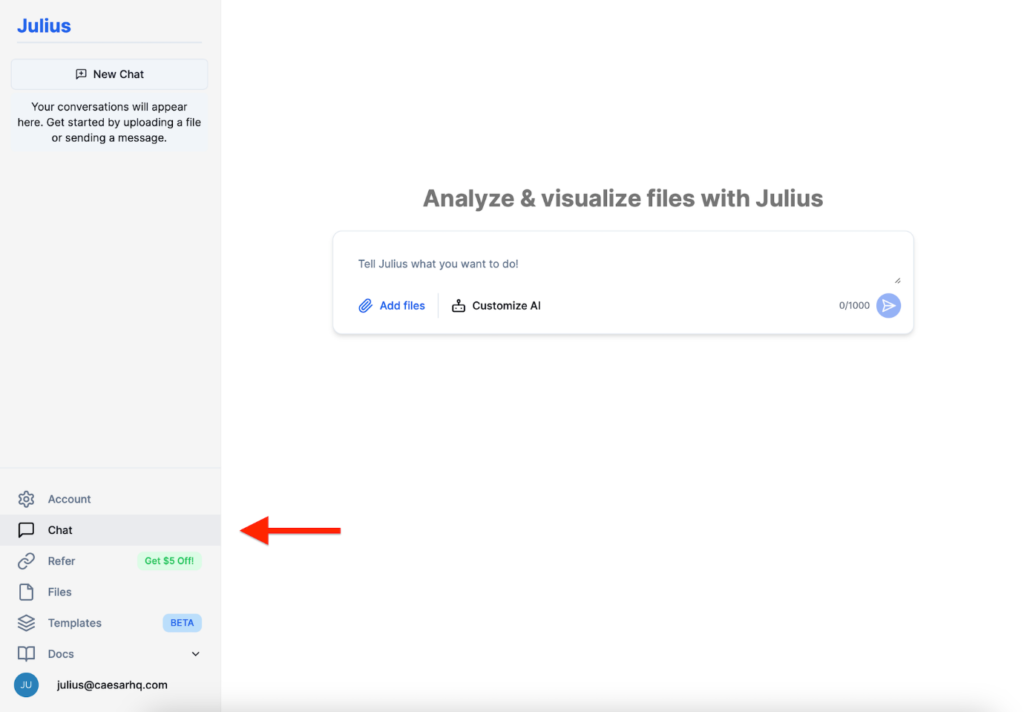
Step 2: Creating a Conversation
Head to the Chat page, where you’ll find a list of all your conversations. Easily navigate and manage your ongoing interactions.
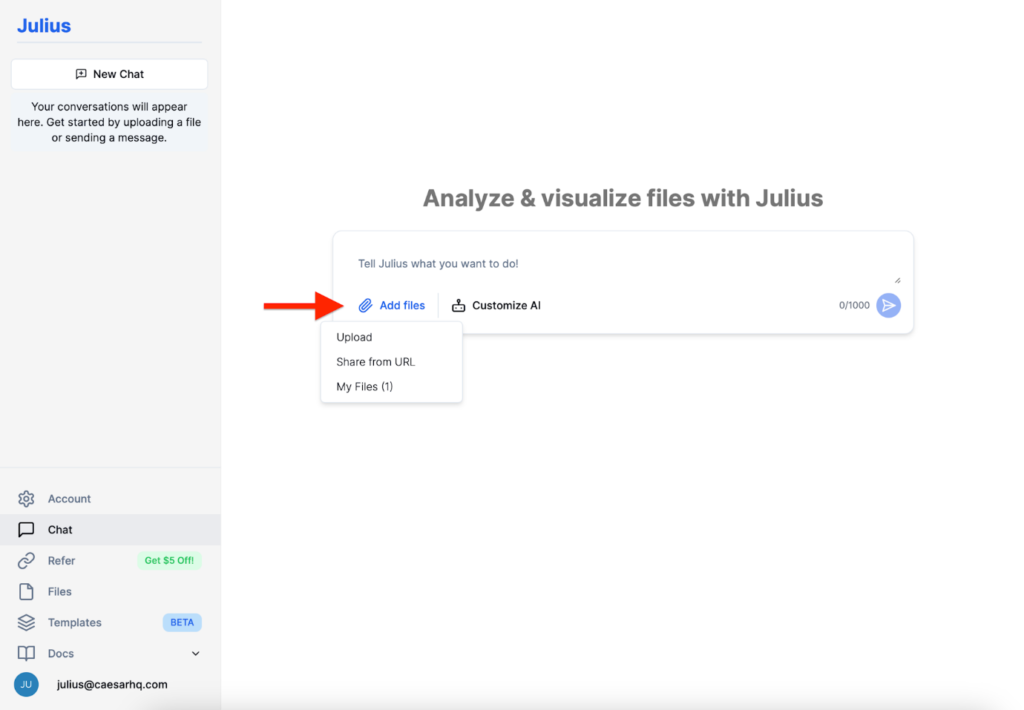
Step 3: Setting the Active Data Source
Select an existing data source or add a new one. Enter your initial instruction and kick off your first Chat by sending the message.
Step 4: Analyzing and Transforming Data
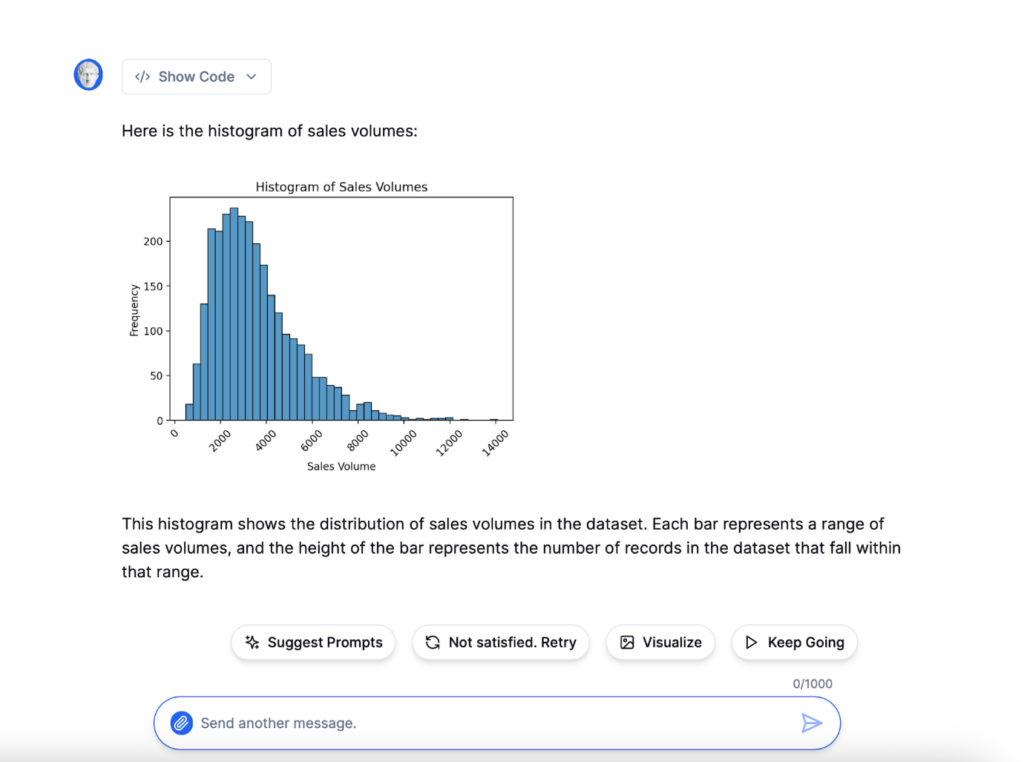
Once your data source is linked, ask Julius to perform analysis and transformations using natural language commands. From filtering, aggregating, performing regressions, sorting and more, Julius handles it all. For example, you might say, “Show me the average sales by product category,” or “Sort the data by customer age.”
Step 5: Visualizing Data
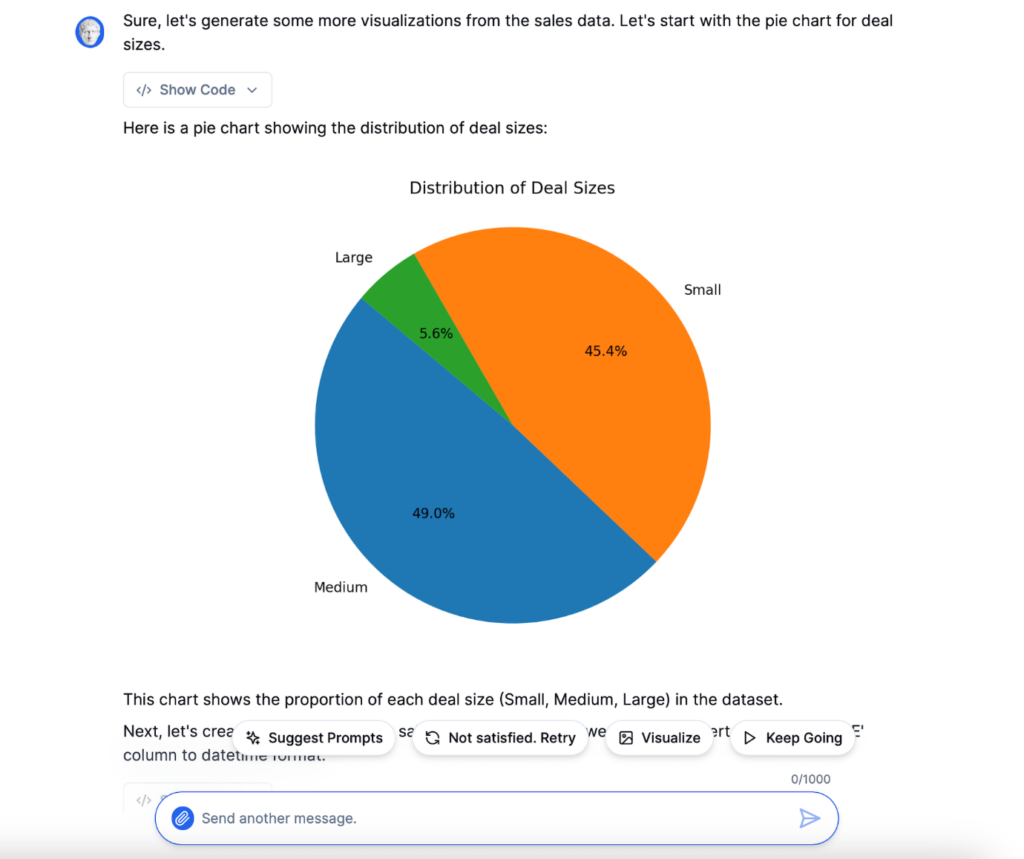
Prompt Julius to create various visualizations, from bar plots to pie charts. Explore your data in a visually compelling manner.
- Bar plots: Useful for comparing quantities across categories. For example, “Show me a bar plot of sales by product category.”
- Line plots: Useful for showing trends over time. For example, “Show me a line plot of sales over time.”
- Histograms: Useful for showing the distribution of a variable. For example, “Show me a histogram of customer ages.”
- Scatter plots: Useful for showing the relationship between two variables. For example, “Show me a scatter plot of age versus income.”
- Pie charts: Useful for showing the proportion of categories. For example, “Show me a pie chart of sales by region.”
Step 6: Exporting Data
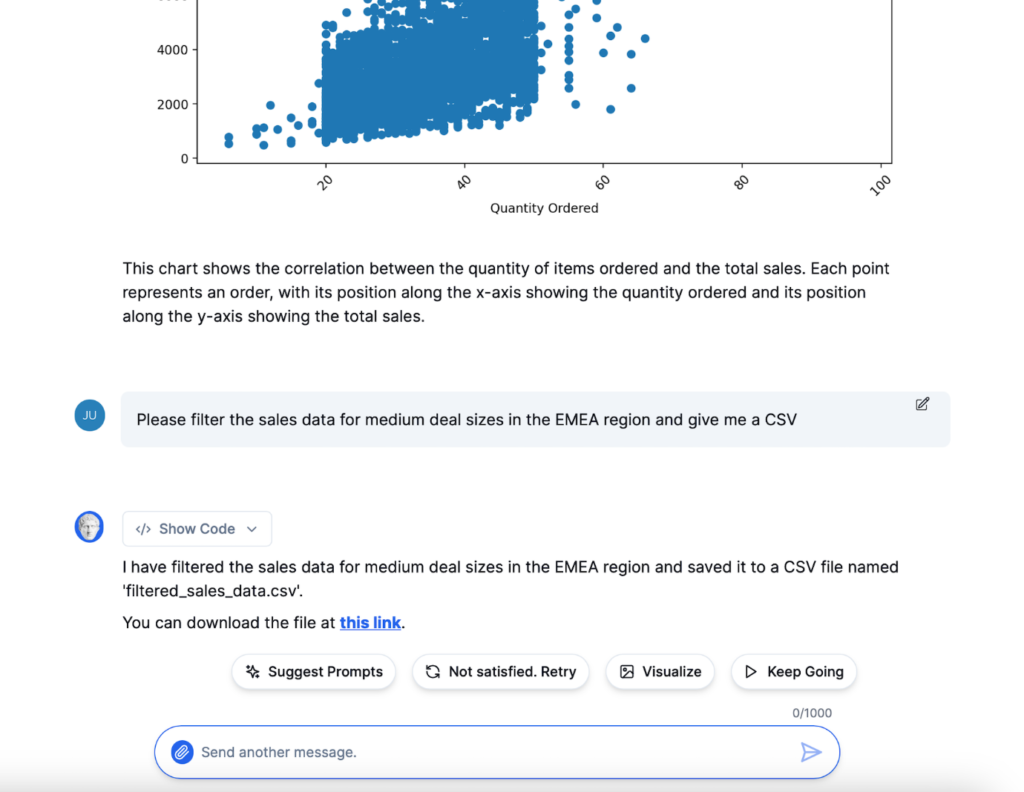
After making changes, instruct Julius to export the data in your preferred format CSV or Excel file. A download link will be generated for easy sharing.
Use Cases for Julius
1. Marketing
Overview
Explore how Julius optimizes marketing campaigns, removing guesswork and enhancing effectiveness.
High-level Purchasing Behavior Analysis
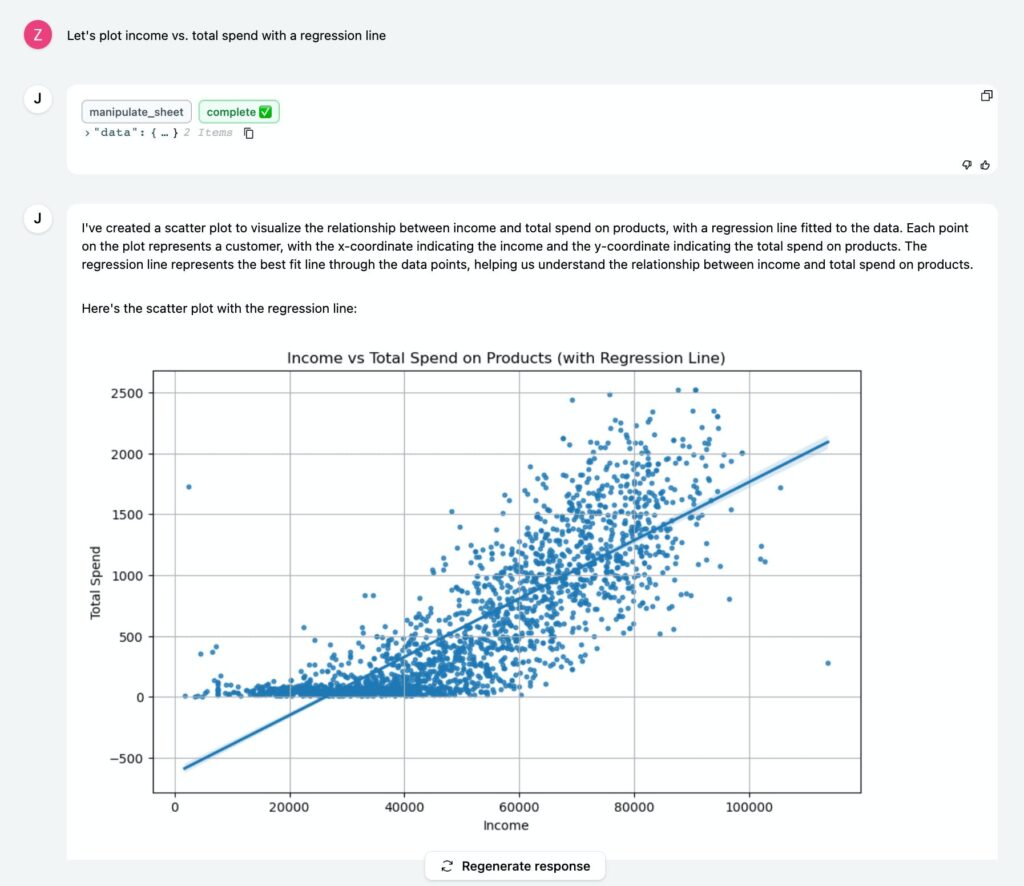
Examine the correlation between income and total spending, gaining insights into specific spending categories.
Further Exploration of Customer Spend
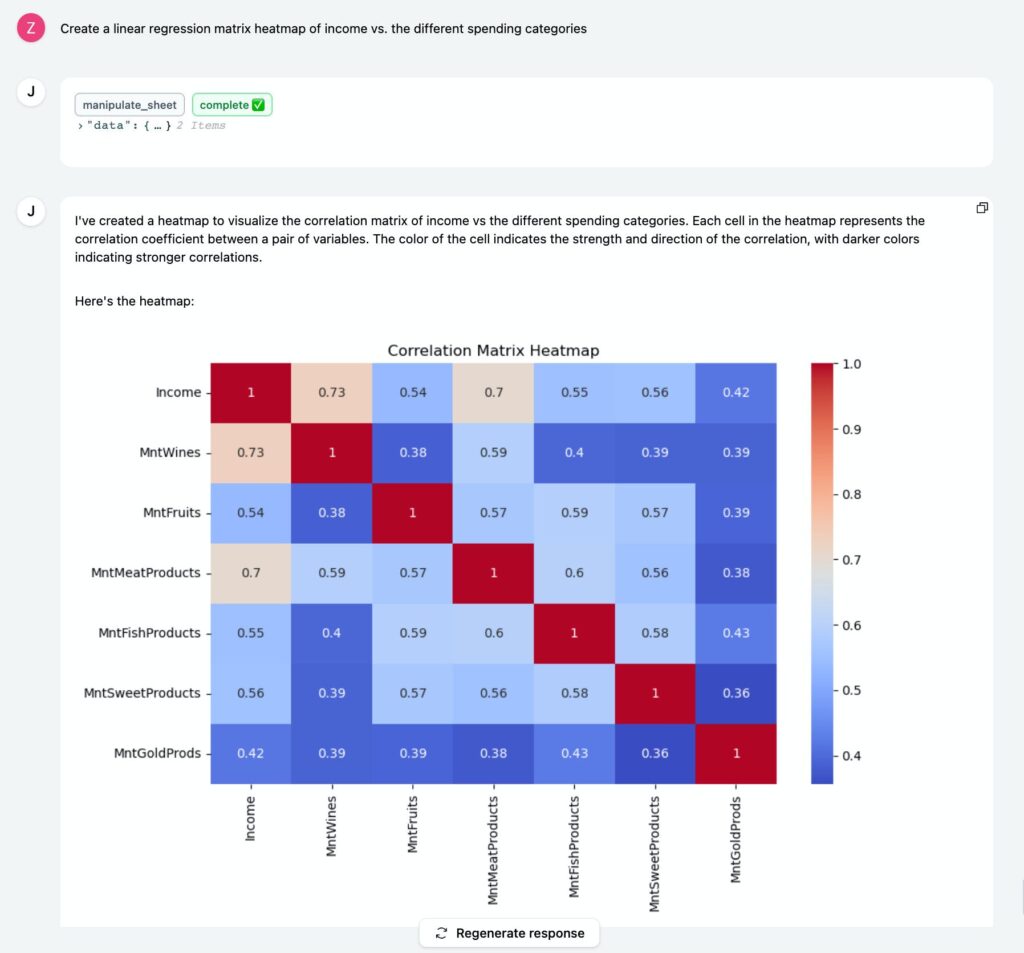
Create a regression matrix to understand correlations with different products, shaping targeted marketing strategies.
Optimizing Future Campaigns
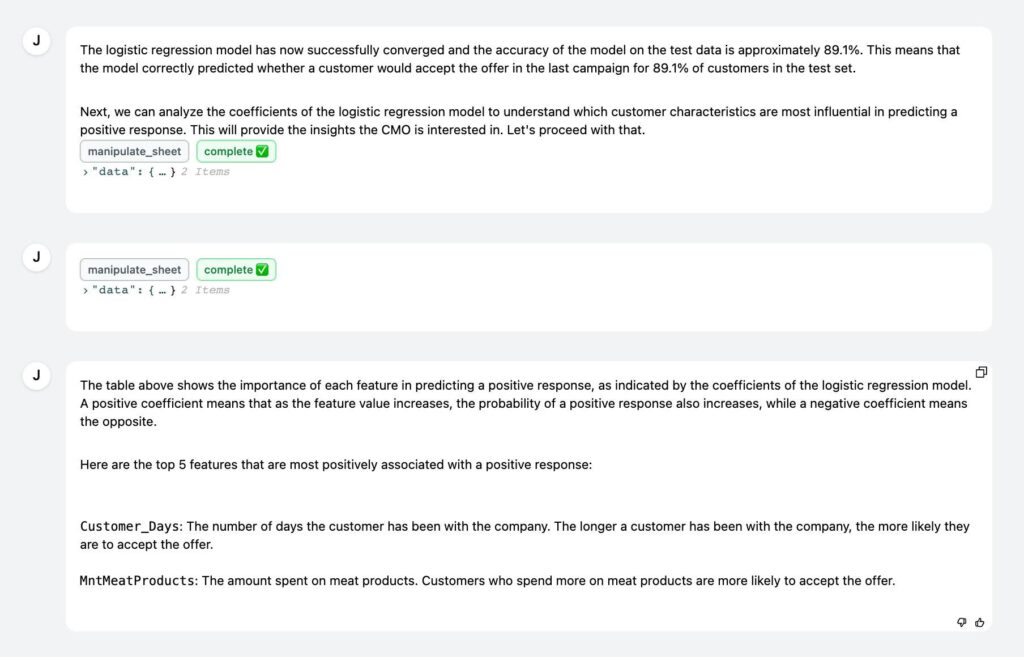
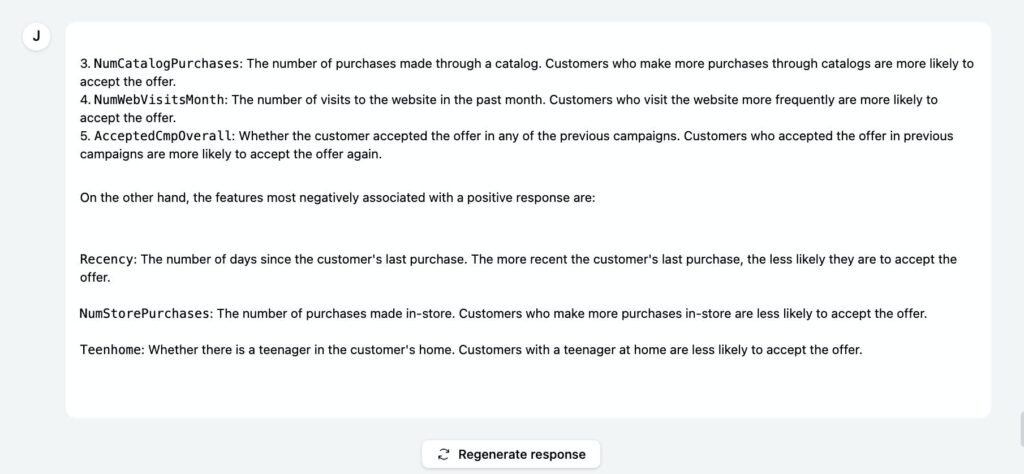
Develop a predictive model using past campaign data, ensuring future campaigns target the most responsive customers with precision.
The prompt used to generate this model was:
“Perform a complex, accurate analysis aiming to improve future campaign performance.”
2. Healthcare
Overview
Unlock valuable insights from patient records, treatment plans, costs, and outcomes with Julius AI.
Getting Started
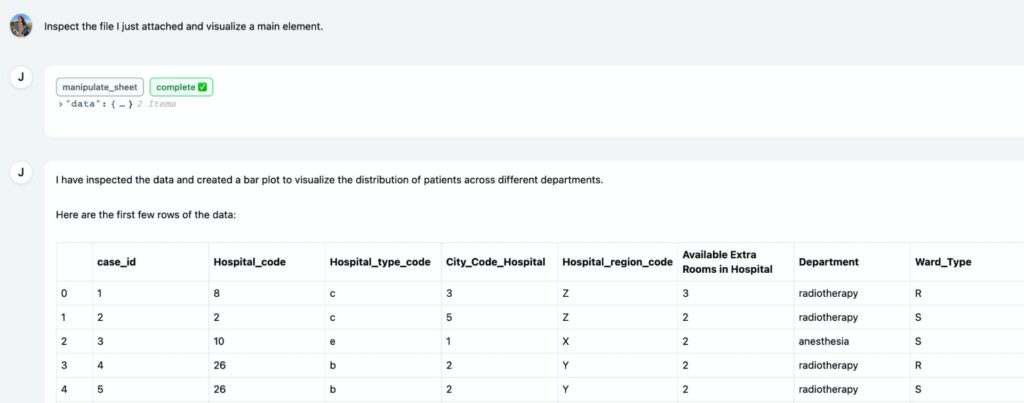
Import your data into Julius by navigating to the My Files tab. Click “Add File” and upload data in multiple formats, including CSV, Excel, and Google Sheets. Julius will automatically assess and understand the nature of the healthcare data.
Gaining Insights from Patient Records
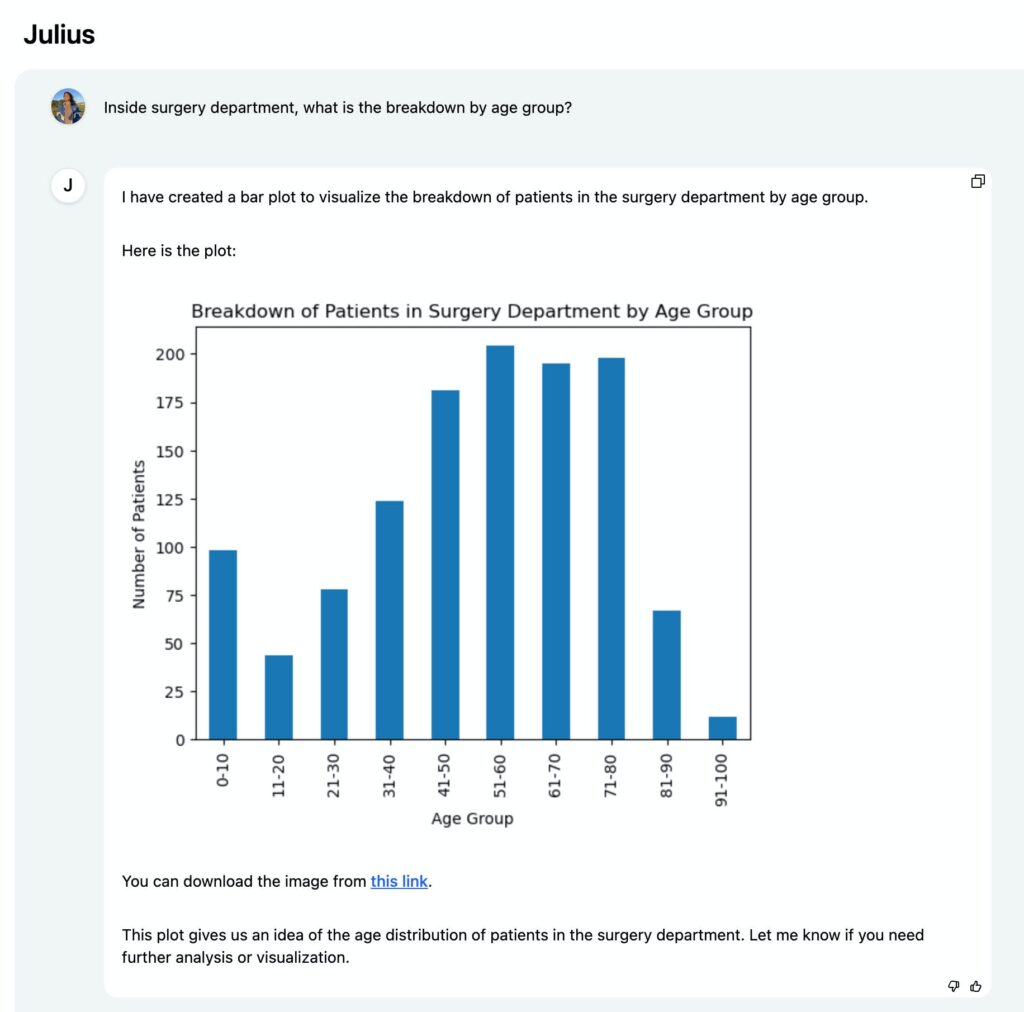
Start your conversation with Julius on the Chat page. Pose queries like “Plot the number of patients by department” to gain an overview of patient distribution.
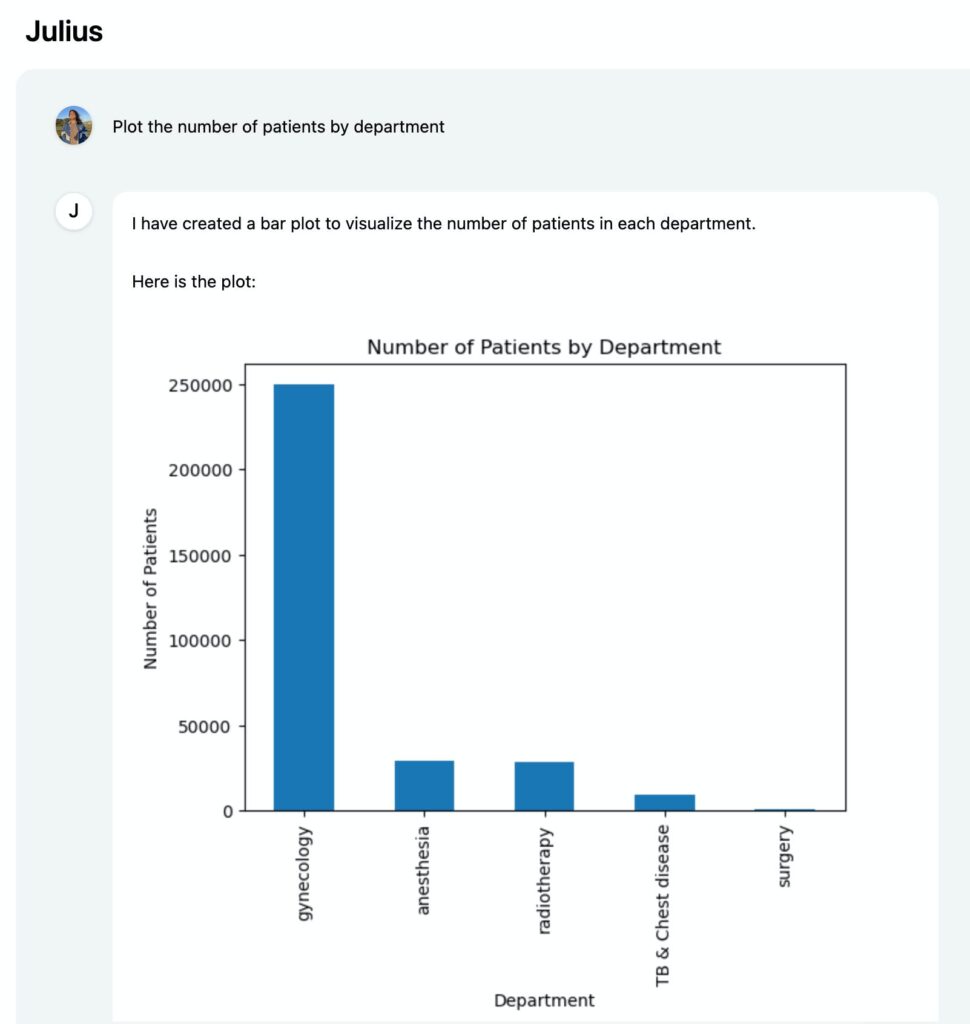
Dive deeper by asking specific questions, such as “Inside the surgery department, what is the breakdown by age group?” Obtain valuable insights effortlessly, like understanding the length of stay for specific patient demographics.
Understanding Patient Behavior
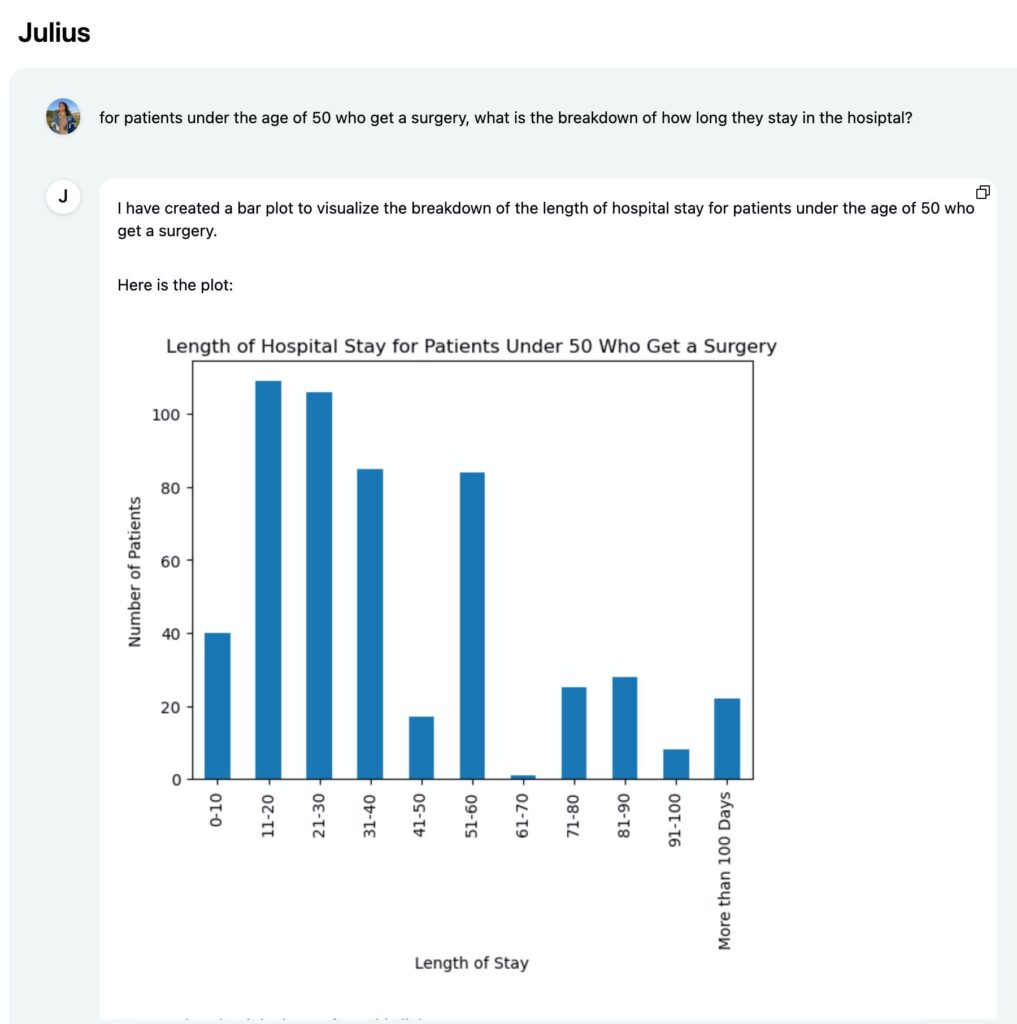
Ask questions like “For patients under the age of 50 who get surgery, what is the breakdown of how long they stay in the hospital?” Explore different facets of patient behavior using natural language commands. Obtain detailed analyses without the need for advanced technical knowledge.
Customized Data Exploration
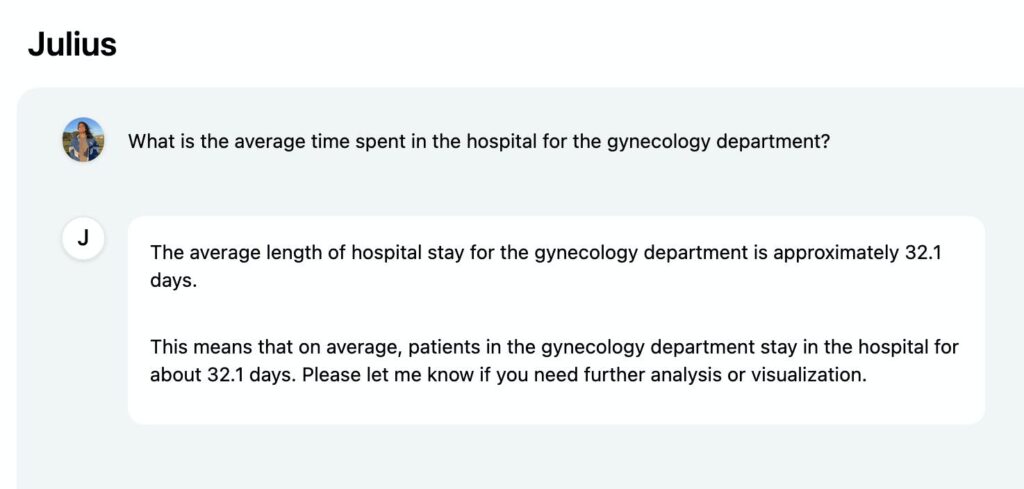
Tailor your queries to specific areas of interest within healthcare data. Utilize Julius’s ability to understand natural language commands, making complex data analytics accessible to healthcare professionals. Explore trends and patterns within patient records for informed decision-making.
3. Academia
Overview
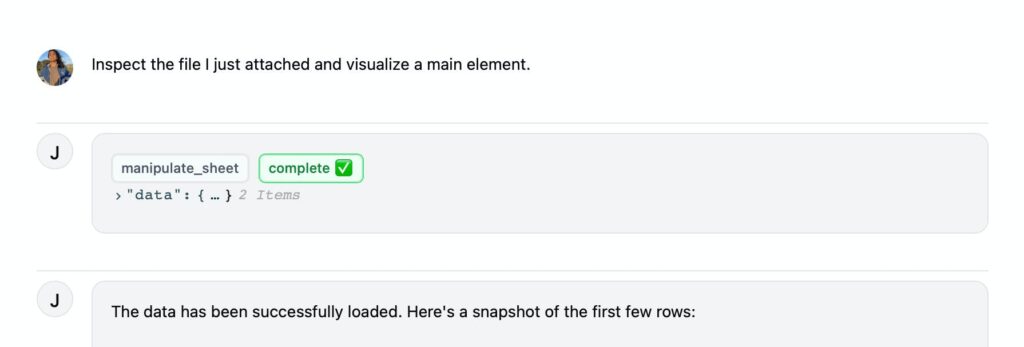
Utilize Julius to analyze survey results, offering a simplified yet powerful solution for academic data analysis.
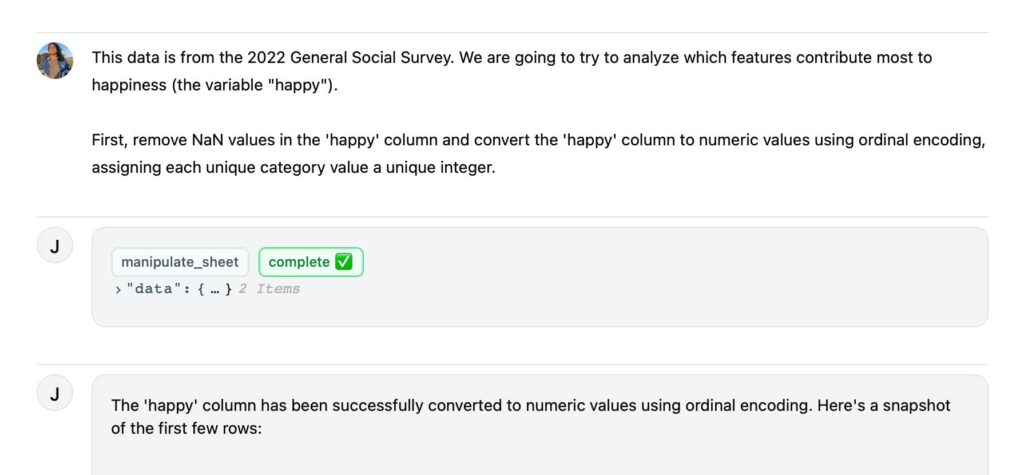
Initial Cleaning of the General Social Survey Results
Clean and prepare data effortlessly with Julius, ensuring a smooth analysis process.
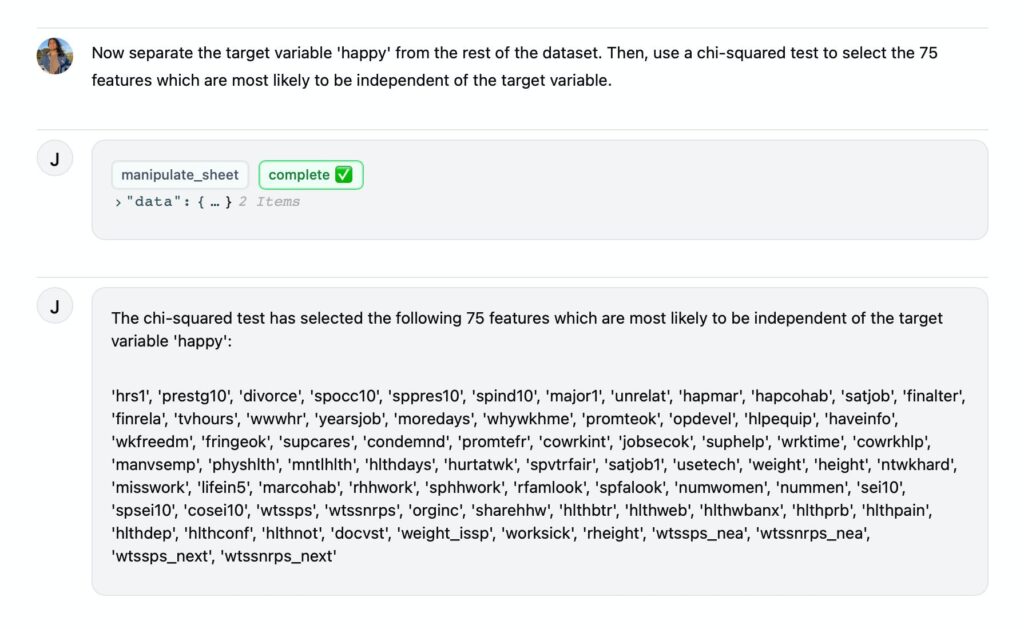
Selecting Features with a Chi-squared Test
Reduce features with a chi-square test, streamlining data for efficient logistic regression analysis.
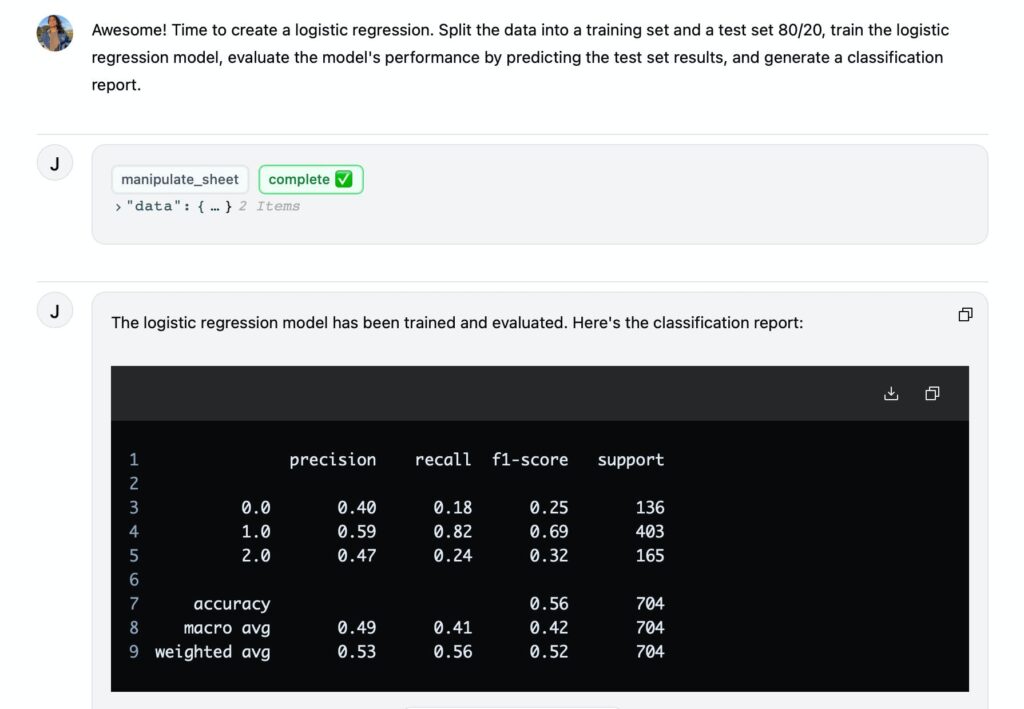
Training a Logistic Regression Model
Gain insights into variables significantly influencing happiness in the US populace, showcasing the ease of complex statistical analysis with Julius.
Finally, we will look at the significance of the coefficients to identify which predictor variables have a significant relationship with the response variable.
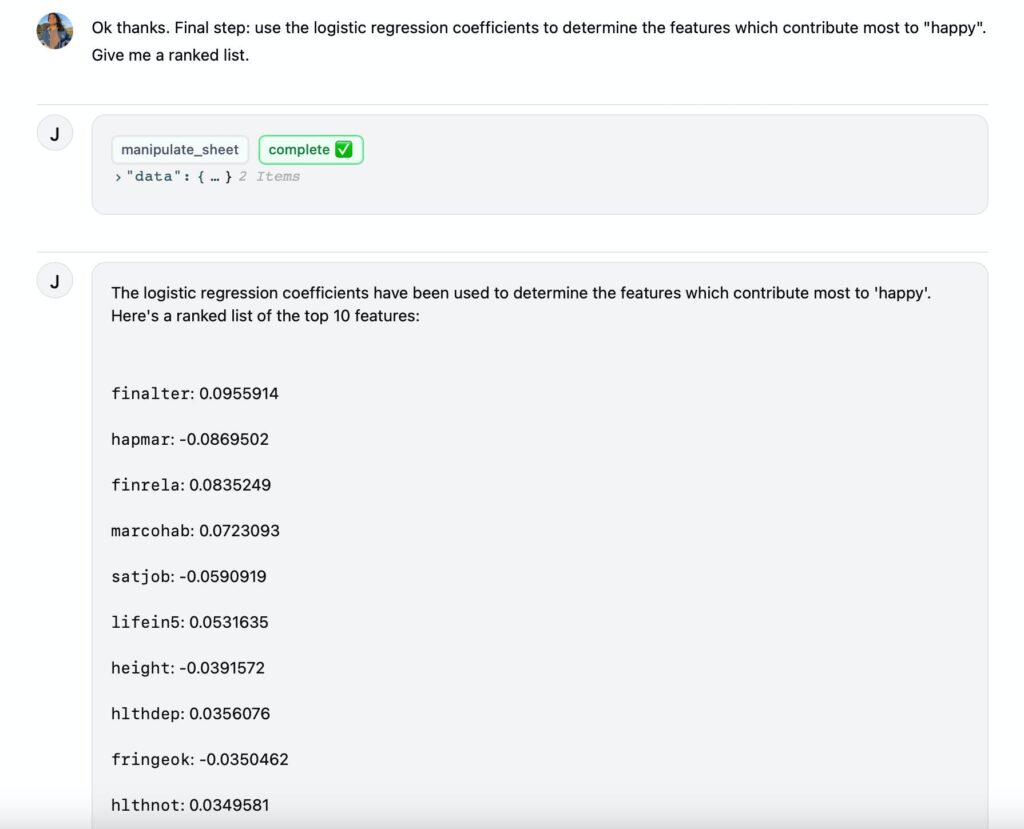
According to their model, the variables with the most significant relationships to happiness are:
- Finalter — whether an individual’s financial situation has been getting better, worse, or has it stayed the same.
- Hapmar — happiness level of marriage.
- Finrela — perceived income level relative to “American families in general”.
- Marcohab — cohabitation status; whether married or not, and whether cohabitating with a partner or not.
- Satjob — job satisfaction.
Training a logistic regression model is a great example of a relatively complex statistical analysis made far easier using Julius.
4. Economics
Overview
Learn how to create time-series data GIFs with Julius using data from the International Energy Organization.
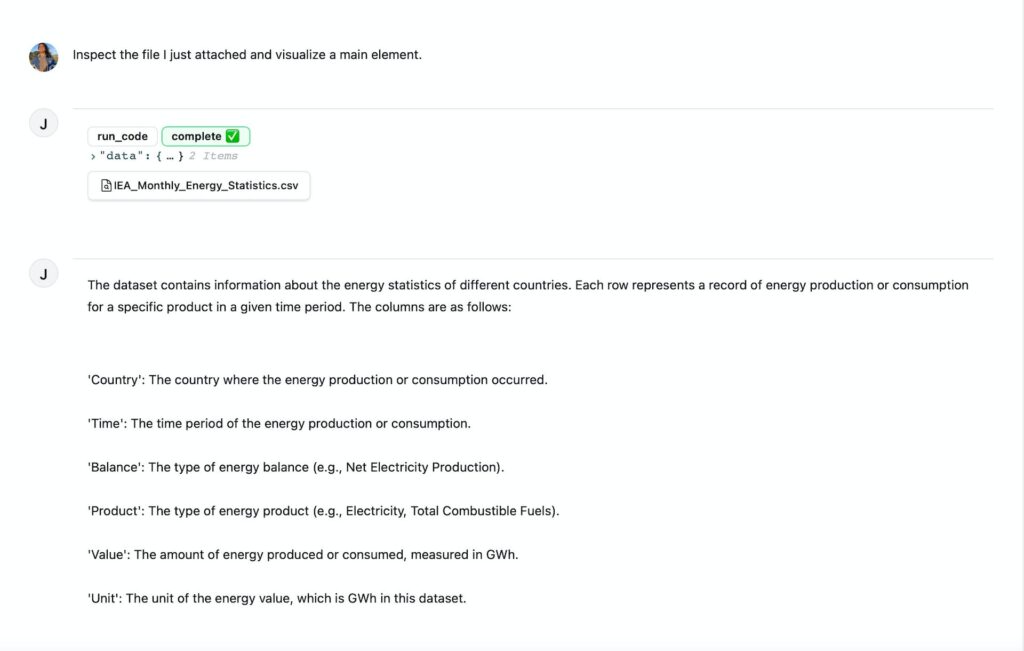
Diving into the Data
Explore monthly energy statistics, breaking down renewable energy production for insightful observations.
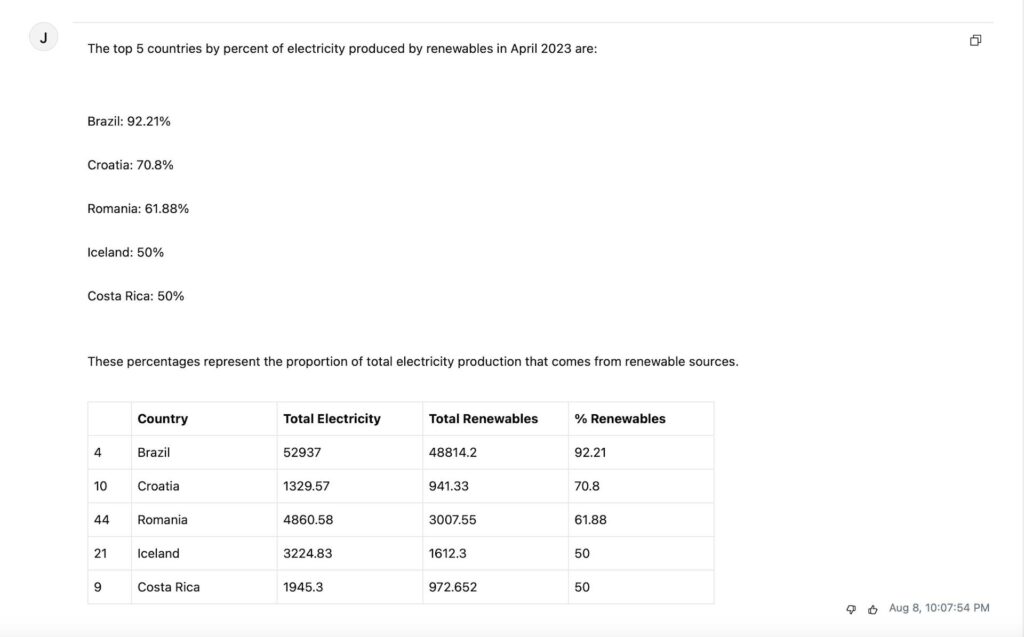
Visualizing and Animating Data
Generate animated time-series charts, effectively communicating trends and insights in global energy data.
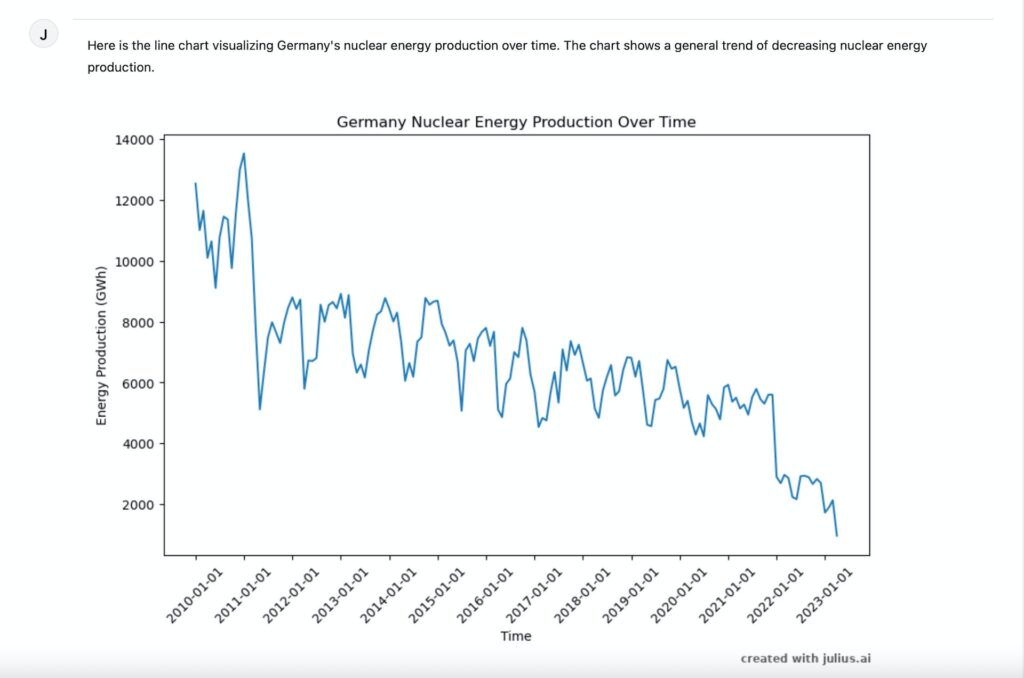
Now, let’s animate this over time. Once you have generated your time-series chart, simply ask Julius:
“Animate this chart over time”

Let’s try this again with coal production over time. First, we will generate a static chart of the top 10 coal energy-producing countries over time.
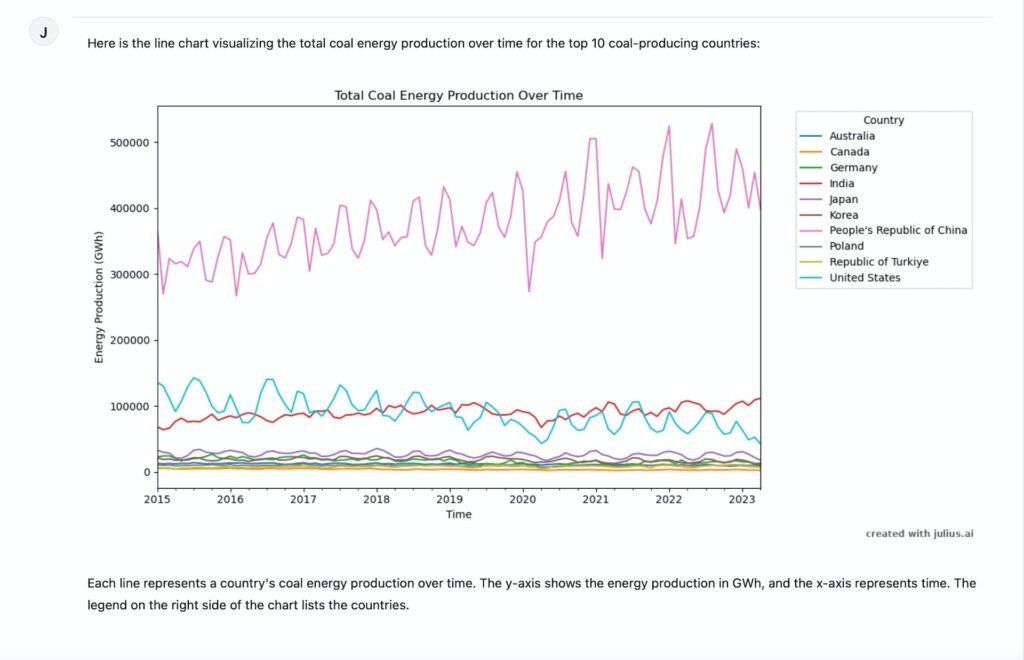
Data Formatting Guidelines
Improper Data Formatting
Common Issues to Avoid
-Multiple Sections- Your spreadsheet cannot have multiple sections.
-Multiple Tables- Similar to the point above, there should not be multiple tables in your uploaded sheet.
-Empty Rows- Make sure there are no empty rows (or columns).
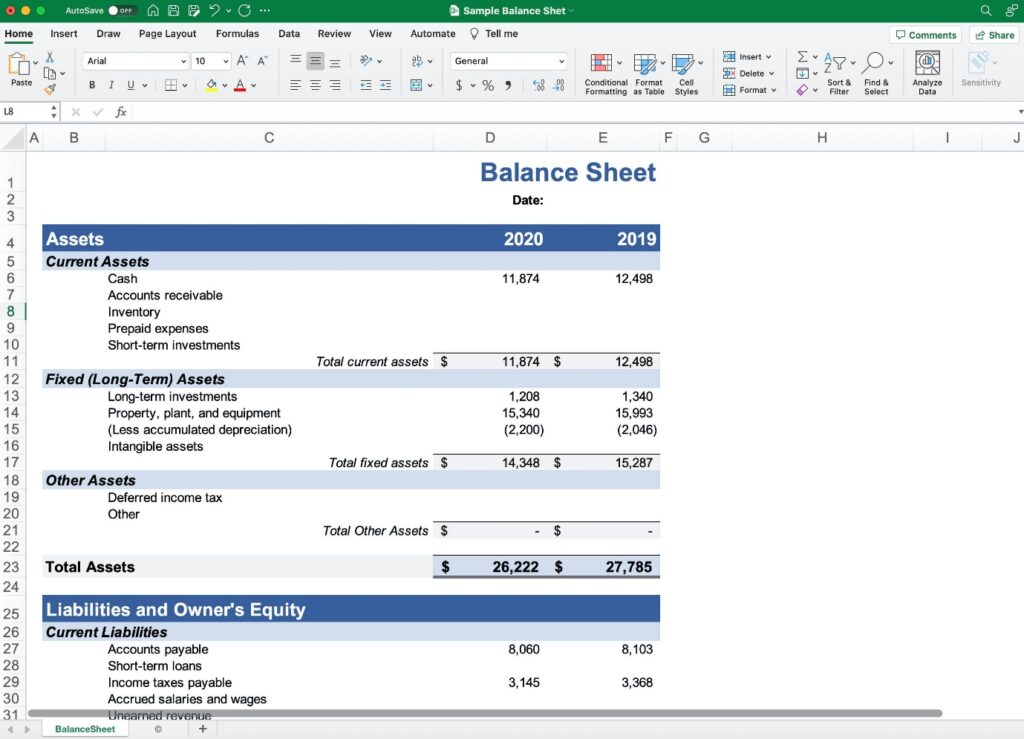
Ensure your data is clean and structured to avoid issues with Julius’ analysis capabilities.

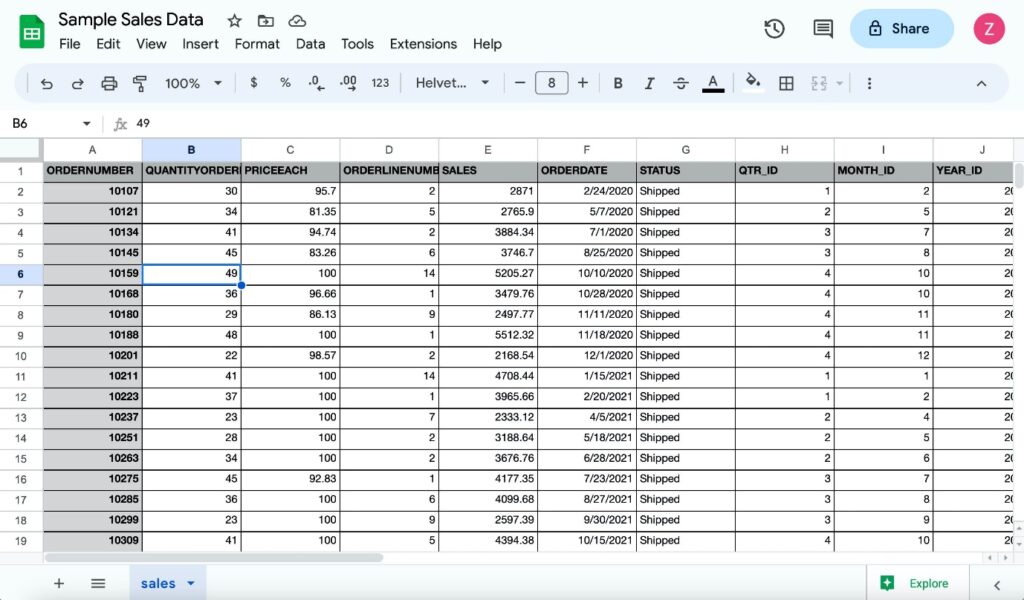
Proper Data Formatting
Best Practices
– Descriptive Column Headers
– Tabulated Data- Your data should be in the form of rows of records below the headers.
– Universality in Language-. Plain, generally understandable language for column names is recommended rather than industry- or company-specific jargon.
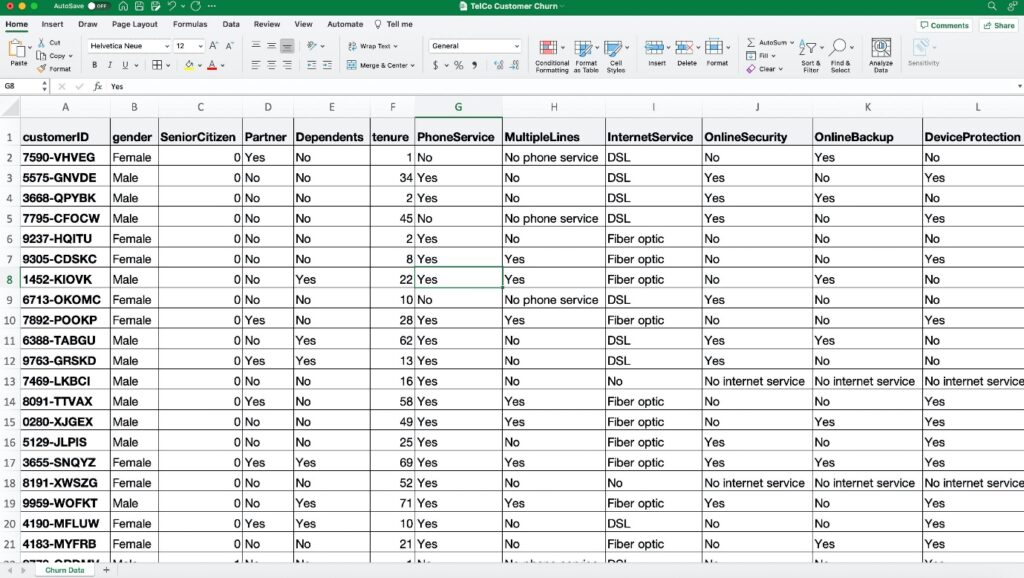
Follow these best practices to enable Julius to perform accurate and error-free data analysis and visualization.
Conclusion
In conclusion, Julius AI stands as a versatile and indispensable tool, transforming the landscape of data analysis with its user-friendly interface and powerful features. Supercharge your data endeavors with Julius AI, where complexity meets simplicity for unparalleled insights.
FAQs
Certainly! Here are some frequently asked questions (FAQs) related to Julius AI:
1. What is Julius AI?
Julius AI is an intelligent data analyst tool designed to interpret, analyze, and visualize complex data in a user-friendly manner. Its key strength lies in making data analysis accessible to individuals without a background in data science.
2. What are the special features of Julius AI?
Julius AI offers a range of special features, including the ability to analyze structured data, generate sleek visualizations, perform advanced analysis (Linear Regression, Modeling, Projections), save time by automating data work, and much more. It aims to simplify data analysis tasks for users.
3. How do I start using Julius AI?
To begin with Julius AI, follow these steps:
– Link a data source in the My Files tab.
– Create a conversation on the Chat page.
– Set the active data source.
– Analyze and transform data using natural language commands.
– Visualize data as needed.
– Export data in your preferred format.
4. What are the use cases for Julius AI?
Julius AI caters to various use cases, such as Marketing, Healthcare, Academia, and Economics. It helps optimize marketing campaigns, unlock insights from healthcare data, simplify academic data analysis, and create time-series data GIFs for economic analysis.
5. How does Julius AI optimize marketing campaigns?
Julius AI optimizes marketing campaigns by providing high-level purchasing behavior analysis, exploring correlations between income and spending, and creating predictive models to target the most responsive customers, ensuring campaigns are more effective and targeted.
6. Can Julius AI be used in healthcare?
Yes, Julius AI is applicable in healthcare. It helps gain insights from patient records, treatment plans, costs, and outcomes. Users can explore data effortlessly, from department-level insights to specific age group breakdowns, making complex data analytics accessible in the healthcare domain.
7. Is Julius AI suitable for academia?
Absolutely! Julius AI is a valuable tool for academia, allowing users to analyze survey results, clean and prepare data efficiently, perform statistical analysis like logistic regression, and gain insights into variables affecting outcomes. It simplifies complex data tasks in the academic realm.
8. What insights can Julius AI provide in economic analysis?
In economic analysis, Julius AI allows users to dive into global energy data, explore renewable energy production trends, and create animated time-series charts. It aids in visualizing and communicating trends in data, providing valuable insights for economic research.
9. What are the data formatting guidelines for Julius AI?
Proper data formatting is crucial for Julius AI. Avoid issues by ensuring your data has descriptive column headers, is tabulated in rows below headers, and uses universally understandable language. Issues to avoid include multiple sections, multiple tables, and empty rows.
10. How does Julius AI make data analysis more accessible?
Julius AI makes data analysis accessible by using natural language commands, automating complex tasks, and providing a user-friendly interface. It eliminates the need for advanced technical knowledge, allowing users to focus on extracting meaningful insights from their data.
11. How do I establish a link with a data repository?
You can forge a connection with a data repository either within the Files segment or directly through their Chat interface. For more intricate guidance on establishing this linkage, peruse their Julius Commencement Manual.
12. What steps follow the establishment of a data link?
After cementing a data link, delve into its depths with natural language prompting on the Chat interface—try soliciting insights or instructing Julius to craft a visualization. For supplementary exemplars on Julius utilization, explore their Use Cases section.
13. Which data repositories garner their support?
We presently extend support to any data file format, encompassing but not restricted to Spreadsheets (.xls, .xlsx, .xlsm, .xlsb, .csv), Google Sheets, and Postgres databases (solely within their plugin). Experiment by uploading a divergent file format within their Chat; chances are, it enjoys compatibility.
14. Is it possible to scrutinize spreadsheets with myriad tabs?
Certainly! Integrate your multifaceted spreadsheet just like any other file. Once incorporated, cite the distinctive names of the tabs in your queries, and Julius will undertake analysis corresponding to those tabs.
15. How does one procure the ChatGPT plugin?
Their ChatGPT plugin, christened Chat With Your Data, resides in the ChatGPT plugin emporium. A premium ChatGPT subscription is requisite for plugin access.
16. Are there concessions for students, educators, or professors?
Affirmative! A 50% reduction extends to students and fellow academic members. Enlist, dispatch a brief missive to team@julius.ai apprising us of your student status before subscribing, and we shall divulge the modus operandi for applying the 50% rebate to your account.
17. What encompasses Julius’ stance on data privacy?
We employ stringent access control, ensuring each user exclusively accesses their data within the secure notebook file repository—Their Python code execution environs even undergo sandboxing per user. Moreover, your data undergoes complete obliteration from the servers upon app-based deletion. Further insights into their data protocols await your perusal here.
18. Is this service complimentary?
Indeed! Default privileges permit users to dispatch up to 15 messages monthly with their preeminent AI model. Post reaching the monthly threshold, upgrade prospects beckon within your Account page.
19. What recourse should one adopt if Julius proves unresponsive?
Primarily, validate the precision of your spreadsheet formatting. If a plugin is in play, align your website login email with your ChatGPT plugin login email. For persistent quandaries, reach out to team@julius.ai or engage the Help beacon nestled in the lower right corner of the screen.

Can you be more specific about the content of your article? After reading it, I still have some doubts. Hope you can help me. https://www.binance.com/si-LK/register?ref=V2H9AFPY
Thank you for your sharing. I am worried that I lack creative ideas. It is your article that makes me full of hope. Thank you. But, I have a question, can you help me?
I don’t think the title of your article matches the content lol. Just kidding, mainly because I had some doubts after reading the article.
Thanks for sharing. I read many of your blog posts, cool, your blog is very good.
Your article helped me a lot, is there any more related content? Thanks!
I don’t think the title of your article matches the content lol. Just kidding, mainly because I had some doubts after reading the article.
Thanks for sharing. I read many of your blog posts, cool, your blog is very good.
Can you be more specific about the content of your article? After reading it, I still have some doubts. Hope you can help me.
Can you be more specific about the content of your article? After reading it, I still have some doubts. Hope you can help me.
Thanks for sharing. I read many of your blog posts, cool, your blog is very good.
I don’t think the title of your article matches the content lol. Just kidding, mainly because I had some doubts after reading the article.
Your point of view caught my eye and was very interesting. Thanks. I have a question for you. https://www.binance.com/en-IN/register?ref=UM6SMJM3
Thanks for sharing. I read many of your blog posts, cool, your blog is very good. https://www.binance.com/da-DK/register?ref=V2H9AFPY
I don’t think the title of your article matches the content lol. Just kidding, mainly because I had some doubts after reading the article.
Can you be more specific about the content of your article? After reading it, I still have some doubts. Hope you can help me.
Thank you for your sharing. I am worried that I lack creative ideas. It is your article that makes me full of hope. Thank you. But, I have a question, can you help me?
Can you be more specific about the content of your article? After reading it, I still have some doubts. Hope you can help me. https://accounts.binance.com/hu/register?ref=FIHEGIZ8
Thank you for your sharing. I am worried that I lack creative ideas. It is your article that makes me full of hope. Thank you. But, I have a question, can you help me?
Thanks for sharing. I read many of your blog posts, cool, your blog is very good.
Your point of view caught my eye and was very interesting. Thanks. I have a question for you.
Thanks for sharing. I read many of your blog posts, cool, your blog is very good.
Can you be more specific about the content of your article? After reading it, I still have some doubts. Hope you can help me.
Your point of view caught my eye and was very interesting. Thanks. I have a question for you.
Can you be more specific about the content of your article? After reading it, I still have some doubts. Hope you can help me.
Thank you for your sharing. I am worried that I lack creative ideas. It is your article that makes me full of hope. Thank you. But, I have a question, can you help me?
Outstanding analysis! Don’t miss Sprunki Game – it’s revolutionary!
Thanks for sharing. I read many of your blog posts, cool, your blog is very good.
I don’t think the title of your article matches the content lol. Just kidding, mainly because I had some doubts after reading the article.
Incredible perspective! The simplicity of Trump Coin is truly revolutionary.
Your writing is inspiring! Check out AI Tools List – it’s transforming work through AI innovation.
This post creates pure harmony! Find harmony in Sprunki Incredibox.
⚡ Innovation infinity! Sprunki reaches creative limits.
This post harmonizes beautifully! Create beauty with Spunky Game‘s musical world.
This hit home! Just like how Sprunki OC connects with music lovers on a deeper level.
Fascinating discovery! Retro Bowl captures sports imagination.
Innovative observations! The character-based interface of Sprunki Music masterfully simplifies complex production techniques into intuitive interactions.
Your point of view caught my eye and was very interesting. Thanks. I have a question for you.
Your point of view caught my eye and was very interesting. Thanks. I have a question for you.
Thanks for sharing. I read many of your blog posts, cool, your blog is very good. https://accounts.binance.com/zh-CN/register?ref=VDVEQ78S
I don’t think the title of your article matches the content lol. Just kidding, mainly because I had some doubts after reading the article.
I don’t think the title of your article matches the content lol. Just kidding, mainly because I had some doubts after reading the article. https://accounts.binance.com/zh-CN/register?ref=VDVEQ78S
Thank you for your sharing. I am worried that I lack creative ideas. It is your article that makes me full of hope. Thank you. But, I have a question, can you help me?
Your point of view caught my eye and was very interesting. Thanks. I have a question for you.
Your point of view caught my eye and was very interesting. Thanks. I have a question for you.
Your article helped me a lot, is there any more related content? Thanks!
Can you be more specific about the content of your article? After reading it, I still have some doubts. Hope you can help me.
I don’t think the title of your article matches the content lol. Just kidding, mainly because I had some doubts after reading the article. https://www.binance.com/lv/register?ref=B4EPR6J0
Thank you for your sharing. I am worried that I lack creative ideas. It is your article that makes me full of hope. Thank you. But, I have a question, can you help me? https://accounts.binance.com/tr/register-person?ref=W0BCQMF1
I don’t think the title of your article matches the content lol. Just kidding, mainly because I had some doubts after reading the article. https://accounts.binance.com/register?ref=P9L9FQKY
Your article helped me a lot, is there any more related content? Thanks!
Your point of view caught my eye and was very interesting. Thanks. I have a question for you.
79u0vb
QQBidRg jXirJGQa cwkqXkl KCWYxETl bLrtoe
HFe gFAKqz rmmGDAio ntCse FiXANVo YUH